
What are these screens for?
The host menu has three separate pages for measurement. Each one answers a different question.
| Page | What does it show? | Where is it measured? |
|---|---|---|
| Visitor statistics | How many people open which pages, where they come from and which devices they use | On NetSSL, without adding code to your site |
| Performance and errors | Your target server's response time and server errors | On NetSSL, without slowing down your site |
| Visitor experience (speed) | How fast pages open on real visitors' phones and computers | In the visitor's browser, with a small measurement script |
When should you use them?
- You need to report monthly visitor numbers to management or the council.
- You want to see how many people an announcement or a campaign reached.
- Citizens say “the e-municipality site is slow” and you want to find out which page has the problem.
- The payment page returns errors from time to time and you want to see how often.
- You track the page speed metrics that affect Google search rankings.
- You want to see which AI bots crawl your site.
Visitor statistics
The host's Visitor statistics page counts visitors without adding code to your site and without using cookies. The measurement takes place on NetSSL. The data is updated every few minutes.
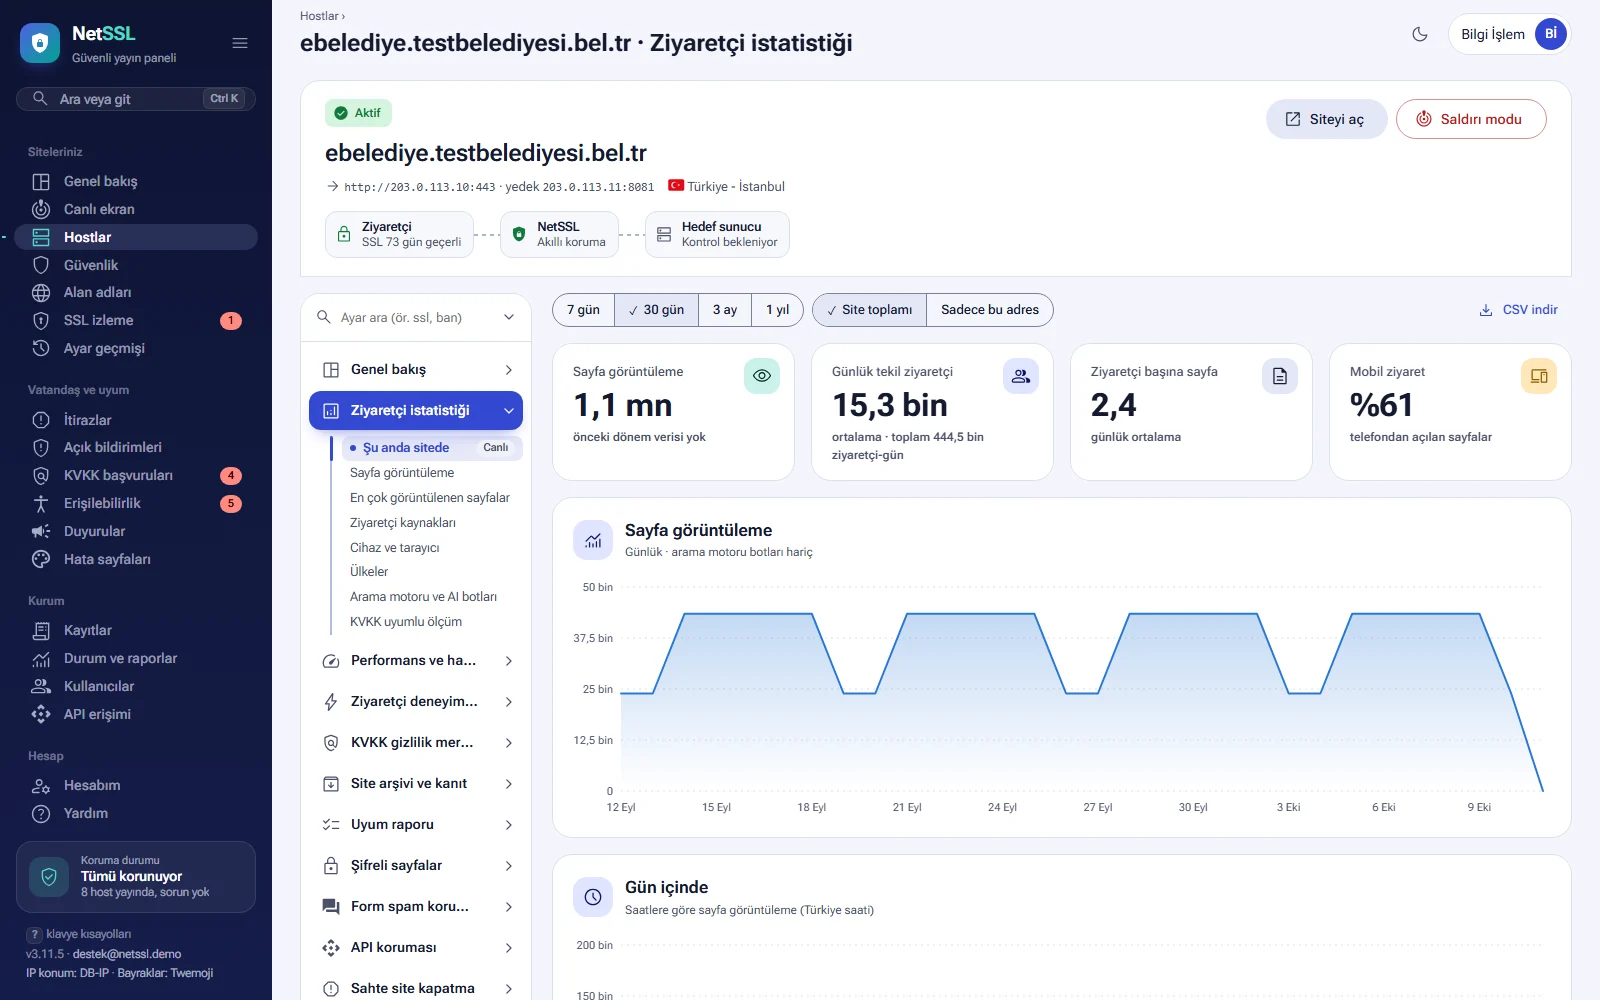
At the top of the page, you choose the period: 7 days, 30 days, 3 months or 1 year. If the site has linked services, you can switch between Site total and This address only. The Download CSV button downloads the data as a table.
| Summary box | What does it show? |
|---|---|
| Page views | Total page views in the period and the change from the previous period |
| Daily unique visitors | The daily average of distinct visitors, counted separately for each day |
| Pages per visitor | How many pages a visitor opens per day on average |
| Mobile visits | The share of pages opened on phones |
On the site now
The On the site now card shows the number of visitors who opened a page in the last 5 minutes. The card also shows page views per minute for the last 30 minutes, the pages being viewed right now and the countries. The card refreshes every 10 seconds. Refreshing stops while the browser tab is in the background.
Page views and time of day
The Page views chart shows the daily total. Search engine bots are not included in this number. The Time of day chart spreads page views across the hours of the day (Türkiye time). You can use this chart to pick the quietest hour for maintenance and updates.
Most viewed pages and visitor sources
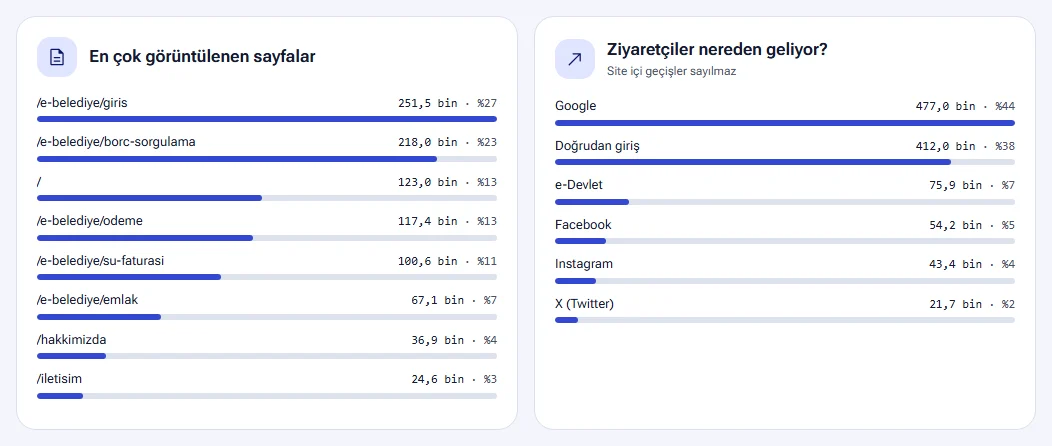
The Most viewed pages list ranks the addresses that are opened most often. The Where do visitors come from? list shows which site visitors arrive from. Google, e-Devlet, Facebook, Instagram, X and direct visits appear on separate rows. Moves from one page of the site to another are not counted.
Device, browser and countries
The Device card shows the shares of mobile, desktop and tablet. The Browser and Operating system cards show which software visitors use. The Countries card lists the countries that visits come from.
Search engine and AI bots
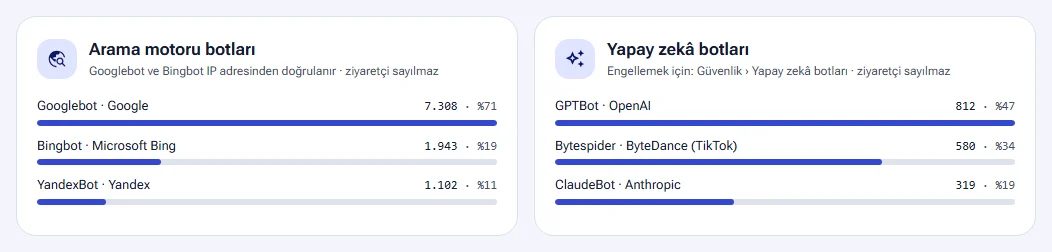
Bots do not count as visitors. Bot requests appear on two separate cards.
- The Search engine bots card shows the number of requests from bots such as Googlebot, Bingbot and YandexBot. Googlebot and Bingbot are verified by their IP address.
- The AI bots card shows the number of requests from bots such as GPTBot, ClaudeBot and Bytespider. To block these bots, use the AI bots setting described in the Bot and access rules guide.
KVKK-compliant measurement
The KVKK-compliant measurement card at the bottom of the page sums up how the measurement works.
- No cookies are used. Nothing is written to the visitor's browser, and no cookie consent is needed.
- No personal data is stored. IP addresses and browser information are not recorded. Only totals are kept.
- Unique visitors are counted with a hash made with a key that changes every day. The hash is deleted from memory after 26 hours. This way, a visitor cannot be tracked from one day to the next.
- You don't need to add code to your site. No data goes to third parties such as Google.
- Search engine bots and automated tools are not counted.
- Totals are kept for 2 years.
Performance and errors
The host's Performance and errors page measures how long your target server takes to deliver pages. The measured time is the time until the first byte of the response. The page also shows which addresses return server errors.
- Image, style and script files are not included in the measurement.
- Requests that NetSSL serves from its cache are not measured.
- Addresses that contain numbers are merged. For example,
/haber/12and/haber/13appear on a single row as/haber/{n}.
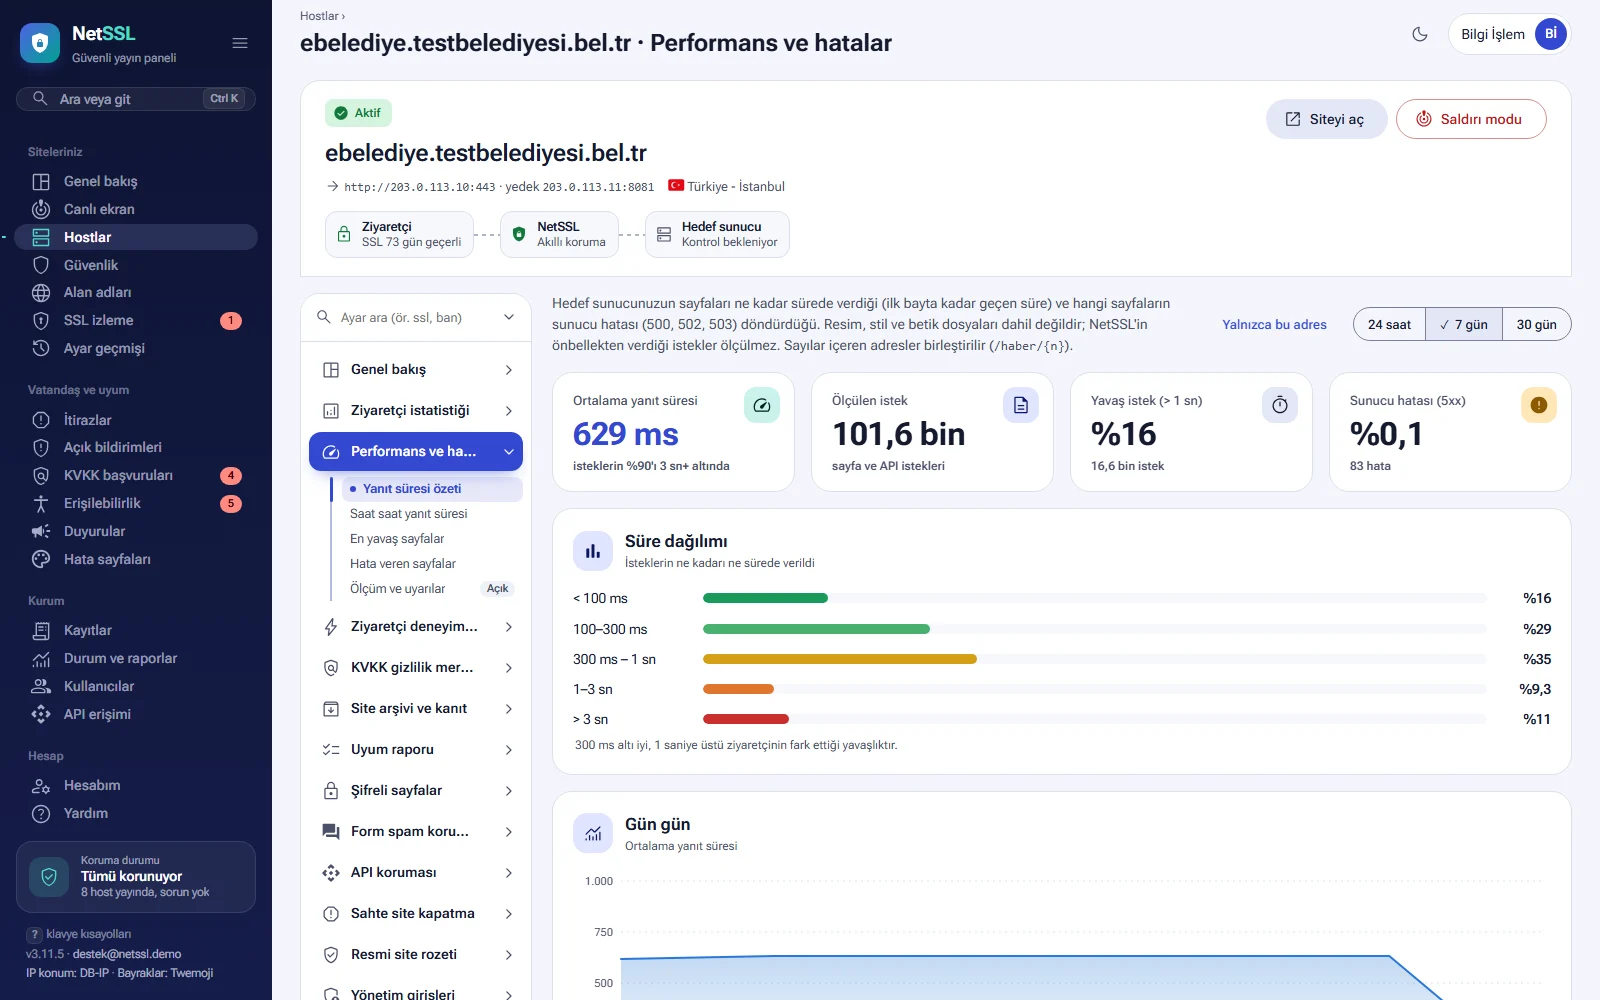
At the top of the page, you choose the period: 24 hours, 7 days or 30 days. If the site has linked services, you can switch between This address only and Include linked services.
Response time summary
| Summary box | What does it show? |
|---|---|
| Average response time | The average time and the time within which 90% of requests are answered |
| Measured requests | The number of page and API requests measured |
| Slow requests (> 1 s) | The share and number of requests that take longer than 1 second |
| Server errors (5xx) | The share and number of requests that return a server error |
Response time by hour and time distribution
The Today by hour chart shows today's average response time for each hour. The chart title also shows the average of the last 7 days. Time distribution shows how many requests were delivered within each time range. Under 300 ms is good. Over 1 second is a slowdown that visitors notice. The Day by day chart plots the daily average over the period.
Slowest pages and pages with errors
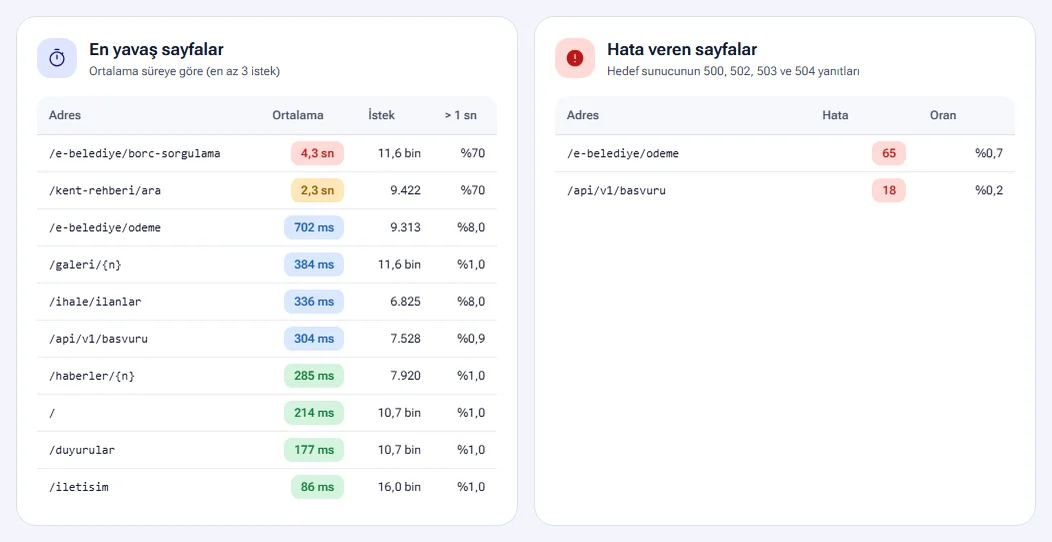
The Slowest pages table ranks addresses by average time. Only addresses with at least 3 requests appear in the table. Each row shows the average time, the number of requests and the share of requests that took over 1 second. The Pages with errors table counts the target server's 500, 502, 503 and 504 responses for each address.
Measurement and alerts
The Measurement and alerts card lets you know if the site slows down or starts to return errors.
- You get an alert if this hour's average response time is more than twice the average of the last 7 days (and at least 700 ms above it) and also over 1 second.
- You also get an alert if more than 5% of requests return a server error in the last hour.
- The alert goes by email to your users who receive notifications. If Telegram and SMS are turned on, it goes through these channels too. The webhook events are named
perf.slowandperf.errors. - At most one alert is sent for the same site every 6 hours.
The Response time and error measurement switch turns the measurement on or off. No personal data, IP addresses or query strings are kept. Only daily totals per address are stored. Notification channels are explained in the Notifications and integrations guide.
A “site has slowed down” alert is often the first sign before a crash. When the alert arrives, check the Slowest pages table and pass the problem on to your software team.
Visitor experience (Core Web Vitals)
The host's Visitor experience page shows how fast your site opens on real visitors' phones and computers. Google uses these three metrics (Core Web Vitals) in search rankings. The assessment is based on the experience of 75% of visits.
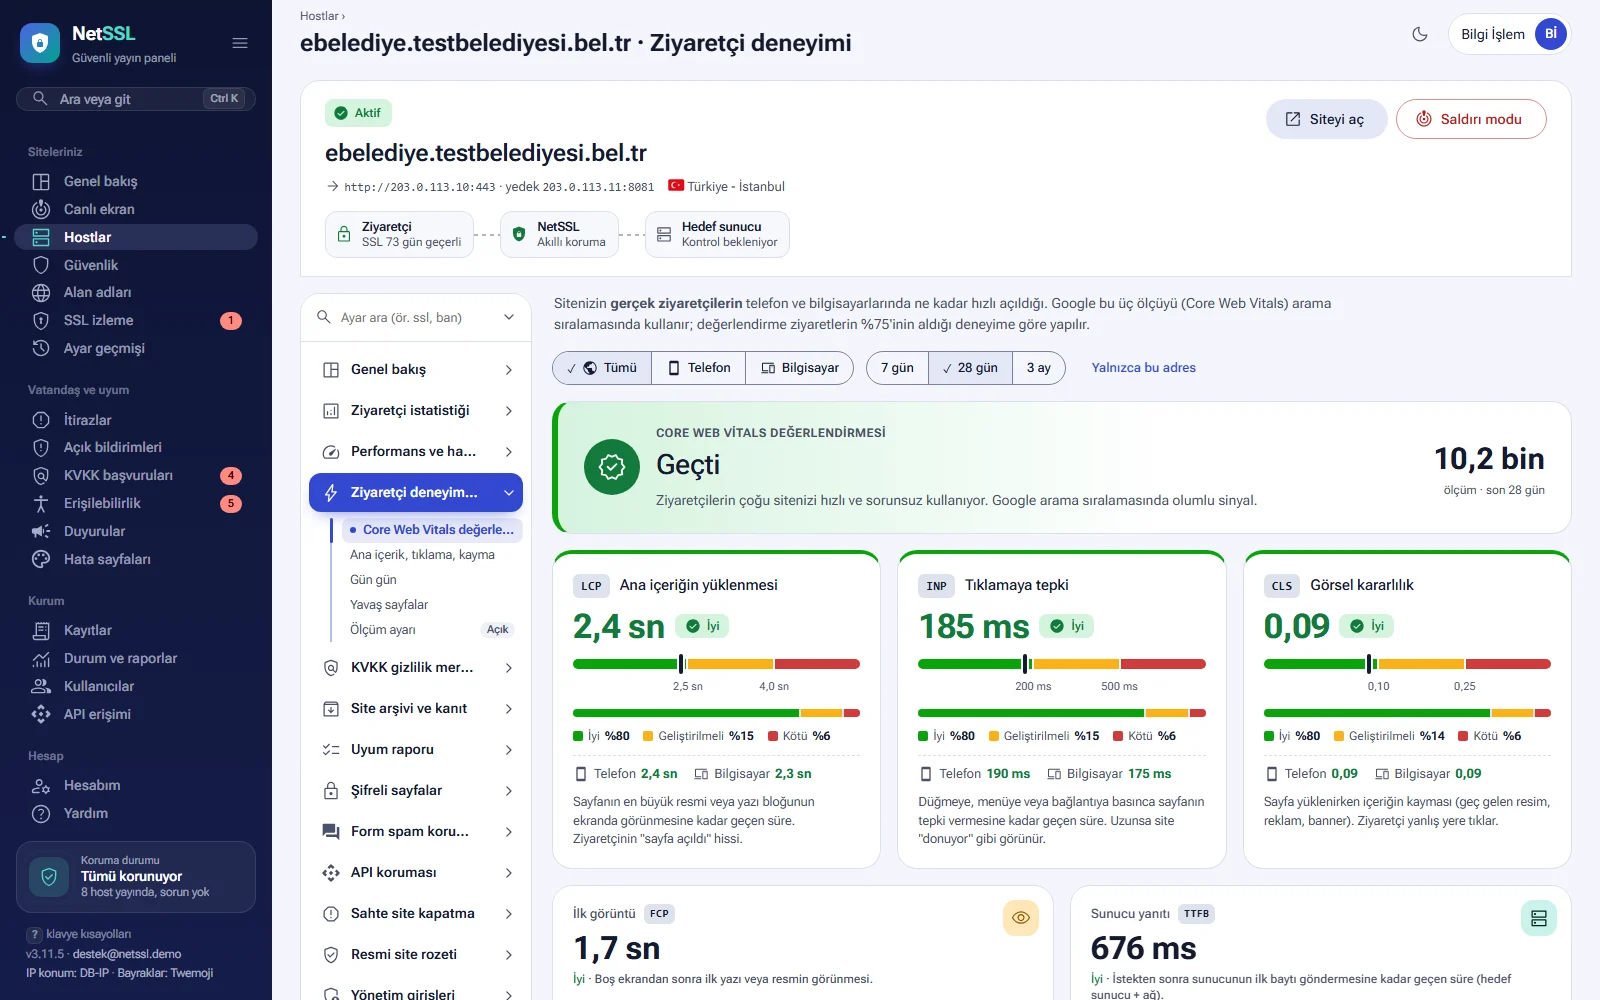
At the top of the page, you choose the device (All, Phone, Computer) and the period (7 days, 28 days, 3 months). Phone and computer results are often different. So look at each of them separately.
Core Web Vitals assessment
The top card shows the result as Passed, Failed or Not enough data. The assessment needs at least 20 measurements for each metric. The number of measurements in the period appears on the right of the card.
Main content, click response, layout shift
| Metric | What does it measure? | Good | Poor |
|---|---|---|---|
| LCP · Main content loading | The time it takes for the largest image or text block on the page to appear on screen. It matches the visitor's feeling that “the page has opened”. | 2.5 s or less | Over 4.0 s |
| INP · Response to clicks | The time the page takes to respond when you press a button, a menu or a link. If it is long, the site seems to “freeze”. | 200 ms or less | Over 500 ms |
| CLS · Visual stability | How much the content shifts while the page loads. An image, ad or banner that loads late makes the visitor click in the wrong place. | 0.10 or less | Over 0.25 |
Each metric card shows the threshold line and the shares of good, needs-improvement and poor experiences. Phone and computer values also appear separately. Below the cards, there are two additional metrics. First paint (FCP) is the time until the first text or image appears after a blank screen. Server response (TTFB) is the time the server takes to send the first byte.
Day by day
The Day by day chart plots the 75% value for each day. A lower value is better. The chart shows days with at least 5 measurements. You switch between LCP, INP and CLS with the selector above the chart.
Slow pages
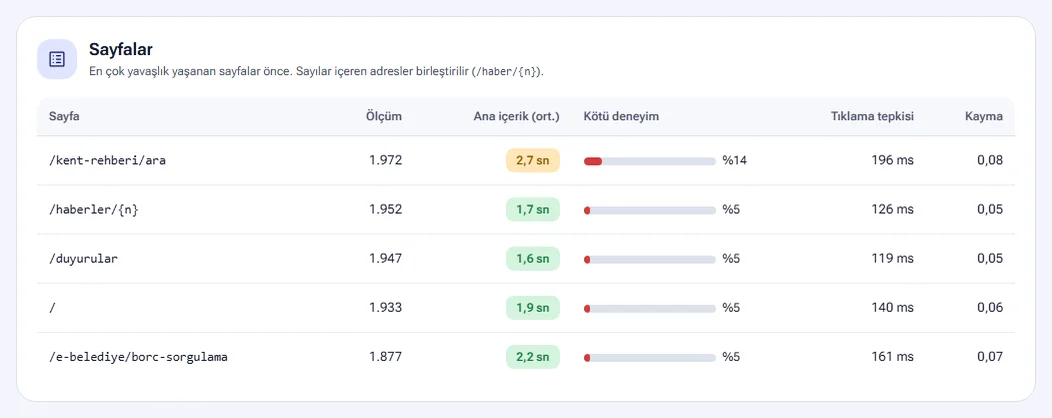
The Pages table lists the pages with the most slowness first. The table shows the number of measurements, the average main content time, the poor experience rate, the click response and the layout shift.
If a metric comes out as Needs improvement or Poor, the How do you speed it up? card appears. The card lists suggestions that you can pass on to your web software team. Here are some example suggestions:
- Upload headline images in WebP format and at the size they are displayed.
- If the target server is slow, turn on static file caching.
- Give images and videos a width and a height.
- Remove unnecessary third-party code.
Measurement setting
NetSSL adds a 3 KB measurement script to the end of your pages. The script comes from the browser cache. The visitor's browser does the measuring and sends a single short request when the page closes. No cookies, IP addresses, personal data or query strings are kept. Only daily totals per page address are stored.
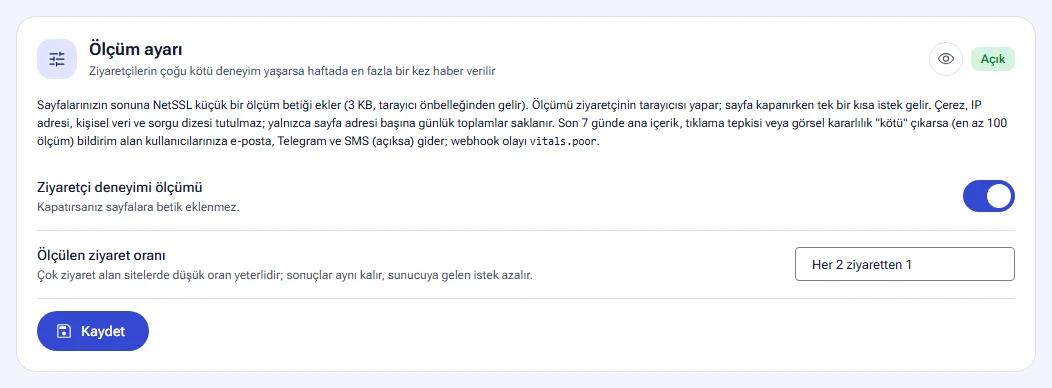
- The Visitor experience measurement switch turns the measurement on or off. When it is off, no script is added to the pages.
- For Measured visit rate, you choose All visits, 1 in every 2 visits, 1 in every 5 visits or 1 in every 10 visits. The default rate is 1 in every 2 visits. A lower rate is enough for sites with many visits. The results stay the same, and fewer requests reach the server.
- If a metric comes out “poor” over the last 7 days (with at least 100 measurements), your users who receive notifications get an email. If Telegram and SMS are turned on, the alert goes through these channels too. The webhook event is named
vitals.poor. This alert arrives at most once a week. - Linked services use the main site's setting.
Frequently asked questions
Do visitor statistics need a cookie consent banner?
No. The measurement does not use cookies and does not write anything to the visitor's browser. IP addresses and browser information are not recorded. That is why no cookie consent is needed.
What is the difference between Performance and errors and Visitor experience?
Performance and errors measures how long your target server takes to send the first byte. Visitor experience measures how the whole page loads on the visitor's device. Even if your server is fast, heavy images or scripts can slow the page down. When you look at both pages together, you can tell whether the problem is in the server or in the page.
Do bots inflate the visitor count?
No. Search engine bots, AI bots and automated tools do not count as visitors. Bot requests appear on separate cards.
Why does the assessment show “Not enough data”?
The assessment needs at least 20 measurements for each metric. The result appears as visits increase. On a site with few visits, you can set Measured visit rate to All visits.
Can I get the data as a table?
Yes. The Download CSV button on the Visitor statistics page downloads the data for the selected period. You can open the file in Excel.