
See How Every Camera Is Performing, on One Page
Analyse the viewing data for every camera on your account together on a single screen. Comparison charts, session details, country breakdowns and a traffic summary make it easy to keep track of how your streams are performing.
This page combines the data from all your cameras into one overview. Which camera is watched most, how many hours of viewing there are in total, which countries people are watching from — you see it all on one page. To reach the detailed report for a specific camera, click its name in the table and the Camera Reporting page opens.
The Report Page
Click the Statistics tab (the chart icon) in the left-hand menu to open the Bulk Camera Report page.
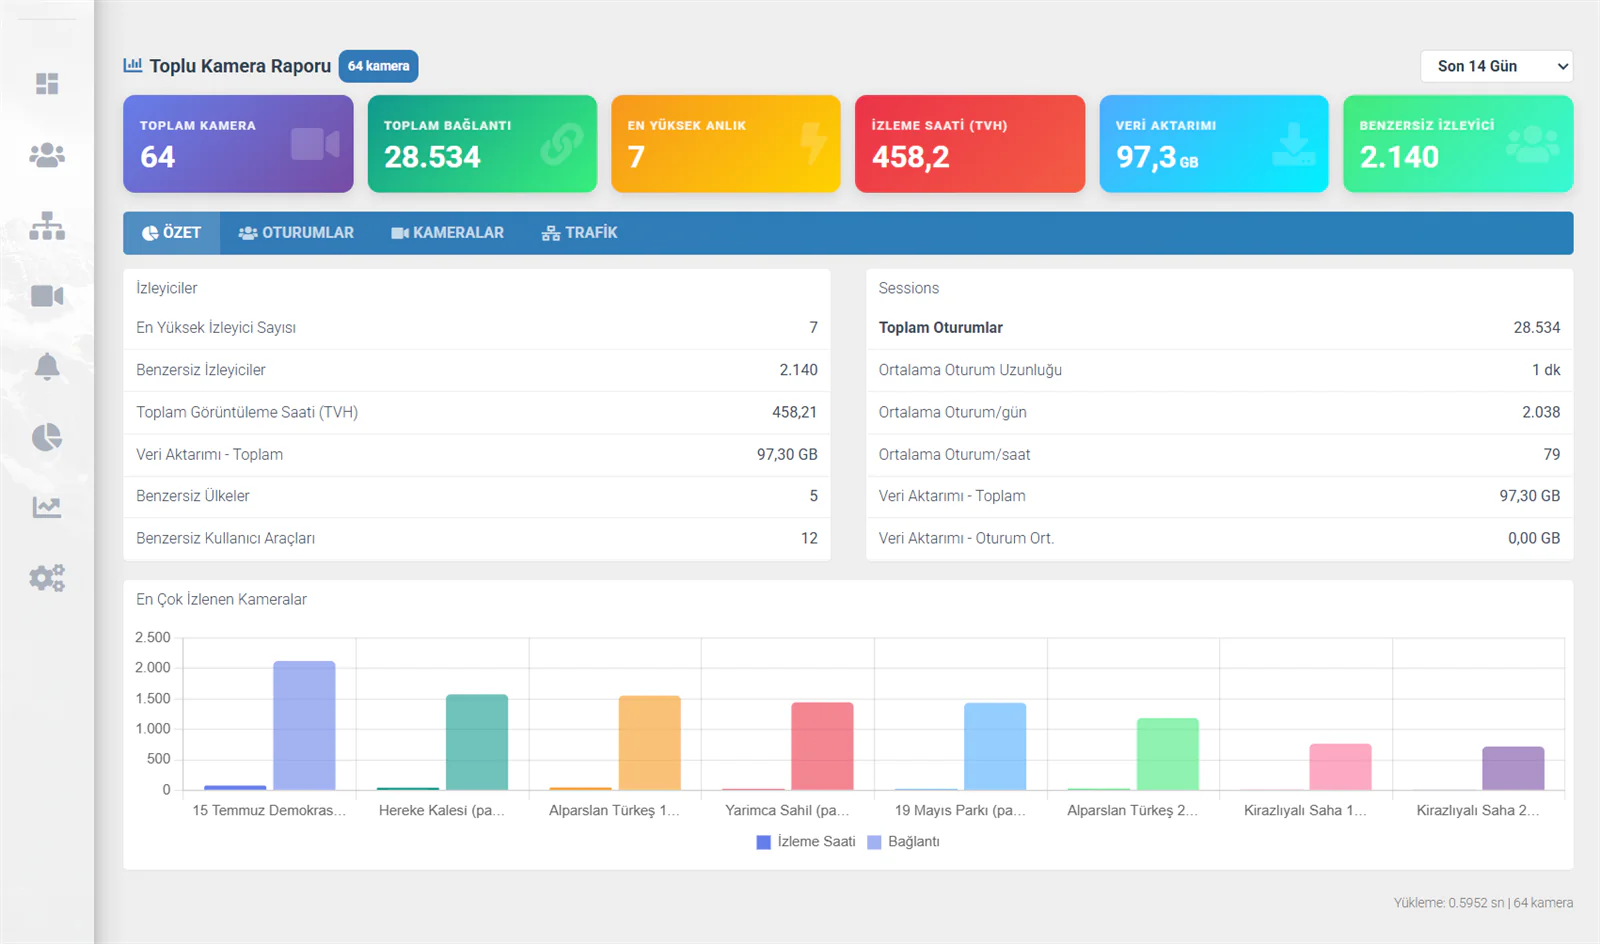
Status Cards
Six colour-coded summary cards for the selected period sit at the top of the page:
| Card | Colour | Description |
|---|---|---|
| Total Cameras | Blue | The total number of cameras on your account |
| Total Connections | Orange | The total number of sessions (connections) opened across all cameras in the selected period |
| Peak Concurrent | Green | The highest number of people watching at the same time |
| Viewing Hours (TVH) | Purple | Total Viewing Hours — the combined watch time across all cameras, in hours |
| Data Transfer | Red | The total bandwidth consumed by all cameras (GB) |
| Unique Viewers | Teal | The number of unique viewers, counted by distinct IP address |
Period Selector
You can change the reporting period from the dropdown in the top right corner. The available periods are:
| Period | Description |
|---|---|
| Last 24 Hours | Data for the past day |
| Last 7 Days | Data for the past week |
| Last 14 Days | Data for the past two weeks |
| Last 30 Days | Data for the past month |
| Last 90 Days | Data for the past three months |
When you change the period, every card, chart and table updates automatically.
Tabs
There are 4 tabs beneath the status cards, each offering a different analytical perspective.
Summary Tab
The default tab that opens first. It shows the combined performance summary for all cameras.
Viewers panel:
| Metric | Description |
|---|---|
| Peak Viewers | The highest number of concurrent viewers in the selected period |
| Unique Viewers | The number of viewers counted by distinct IP address |
| Total Viewing Hours (TVH) | The combined duration of all viewing, in hours |
| Data Transfer - Total | Total bandwidth usage |
| Unique Countries | How many different countries viewers connected from |
| Unique User Agents | How many different browser or device types were used |
Sessions panel:
| Metric | Description |
|---|---|
| Total Sessions | The total number of connections opened |
| Average Session Length | How long an average viewing session lasts |
| Average Sessions/Day | The average number of connections per day |
| Average Sessions/Hour | The average number of connections per hour |
| Data Transfer - Session Avg. | The average data consumption of each session |
Most-Watched Cameras chart:
All your cameras are compared in a bar chart at the bottom of the page, with viewing hours and connection counts shown side by side for each. The most-watched camera appears at the top.
Sessions Tab
Shows session and viewer details, geographic distribution and the devices used.
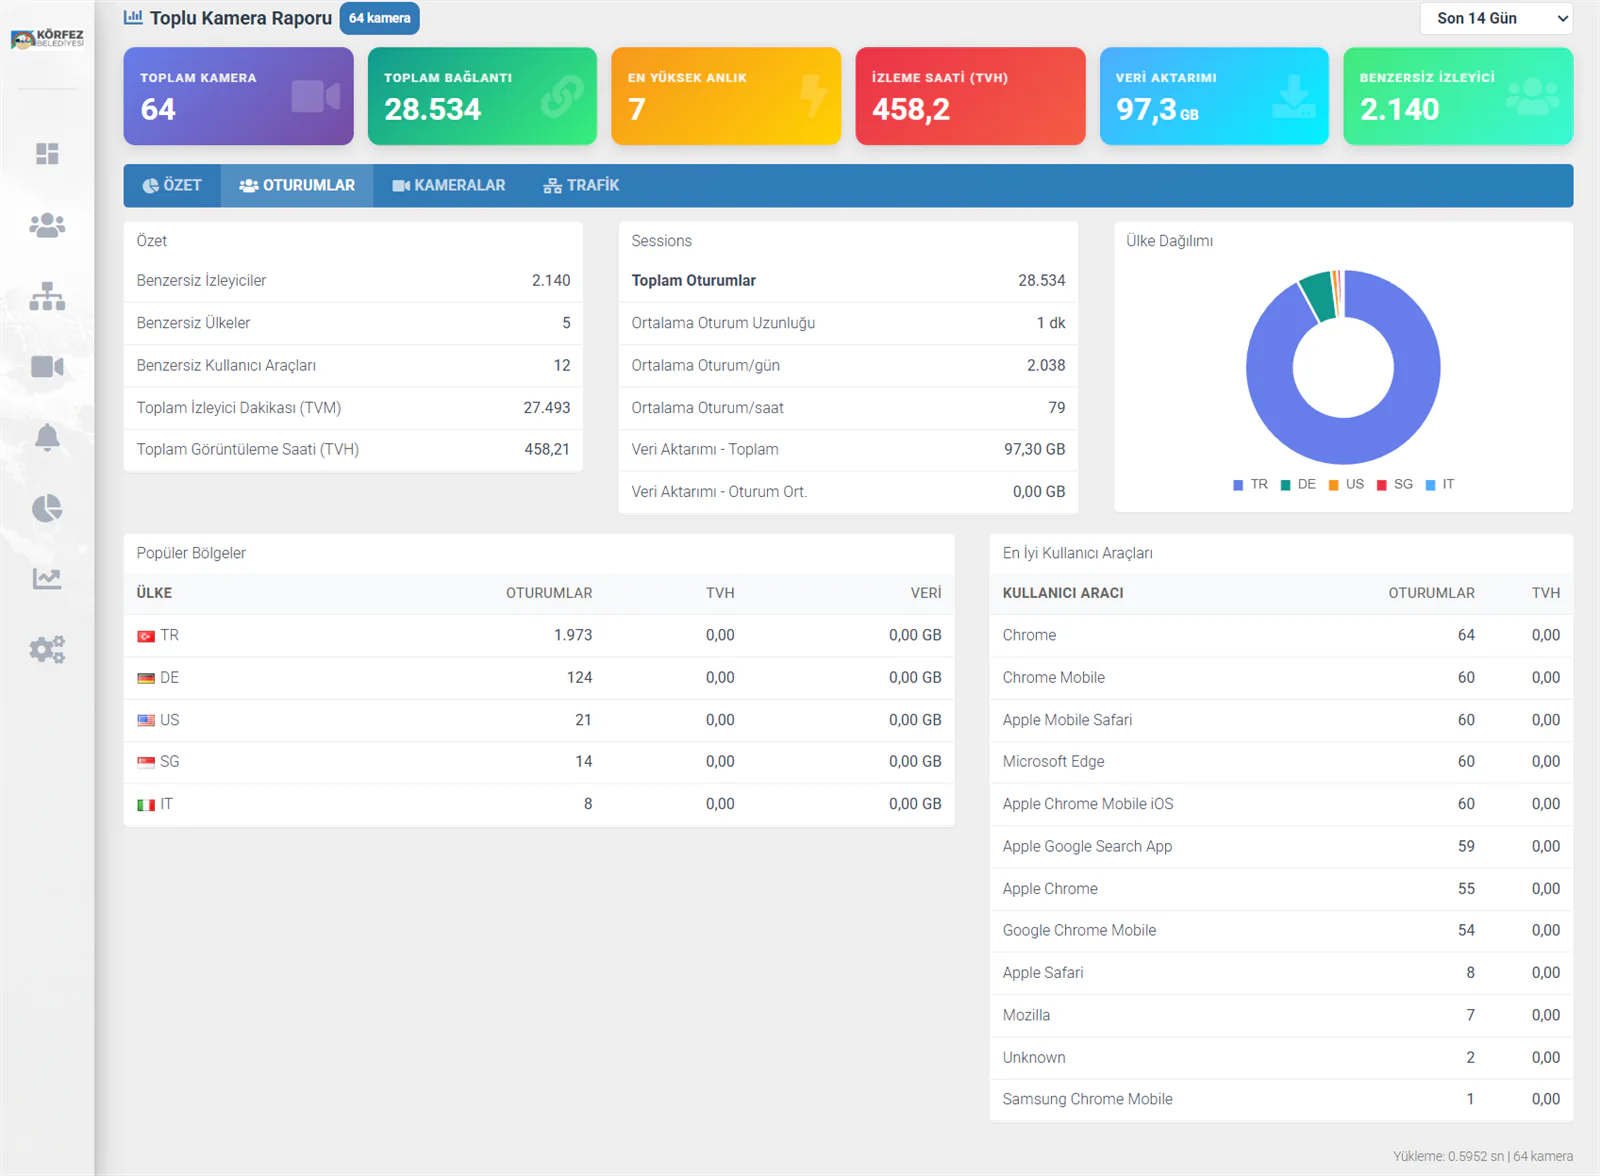
This tab has three main sections:
Country Breakdown — the pie chart at the top right shows how your viewers are distributed across countries.
Popular Regions table:
| Column | Description |
|---|---|
| Country | The country flag and code |
| Sessions | The total number of sessions opened from that country |
| TVH | Total viewing time from that country |
| Data | The bandwidth consumed by that country |
Top User Agents table:
| Column | Description |
|---|---|
| User Agent | The browser or app name (Chrome, Safari, Edge and so on) |
| Sessions | The total number of sessions opened with that agent |
| TVH | Total viewing time with that agent |
Knowing which devices and browsers your viewers use is essential for optimising the player. If a high proportion watch on mobile, for example, your responsive player settings deserve close attention. If older browsers are common, the H.264 codec is the safer choice.
Cameras Tab
Shows all your cameras through comparative charts and a ranked table.
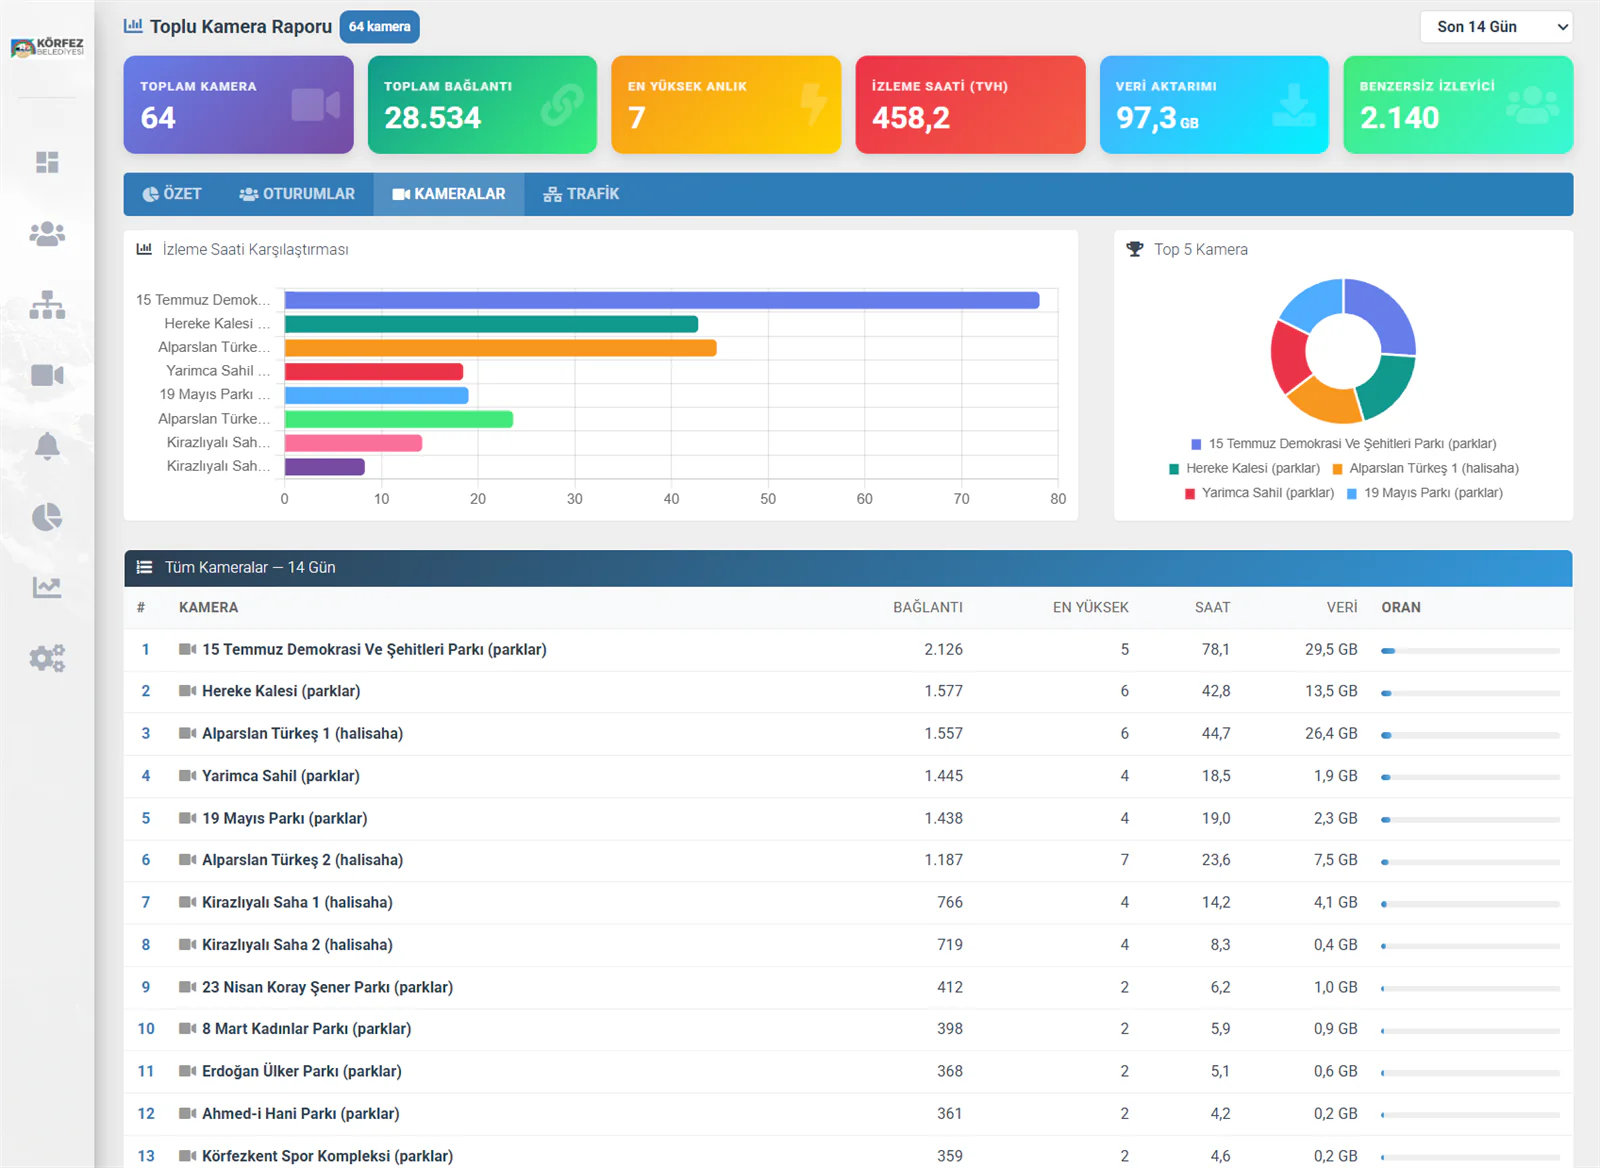
Viewing Hours Comparison — compare your cameras' viewing times side by side in a horizontal bar chart, and take in at a glance how much each one is watched.
Top 5 Cameras — see the proportional split of your five most-watched cameras in a donut chart.
All Cameras table:
| Column | Description |
|---|---|
| # | The ranking number — most watched to least |
| Camera | The camera name — clickable; clicking it opens that camera's detailed report page |
| Connections | The total number of sessions |
| Peak | The highest number of concurrent viewers |
| Hours | Total viewing time in hours |
| Data | Total bandwidth consumed |
| Share | A mini bar showing this camera's share of total viewing |
Clicking any camera name in the table opens that camera's detailed reporting page. For the hourly viewer chart, session list, geographic map and more, see the Camera Reporting page.
Traffic Tab
Shows a daily traffic summary for all cameras as a table.
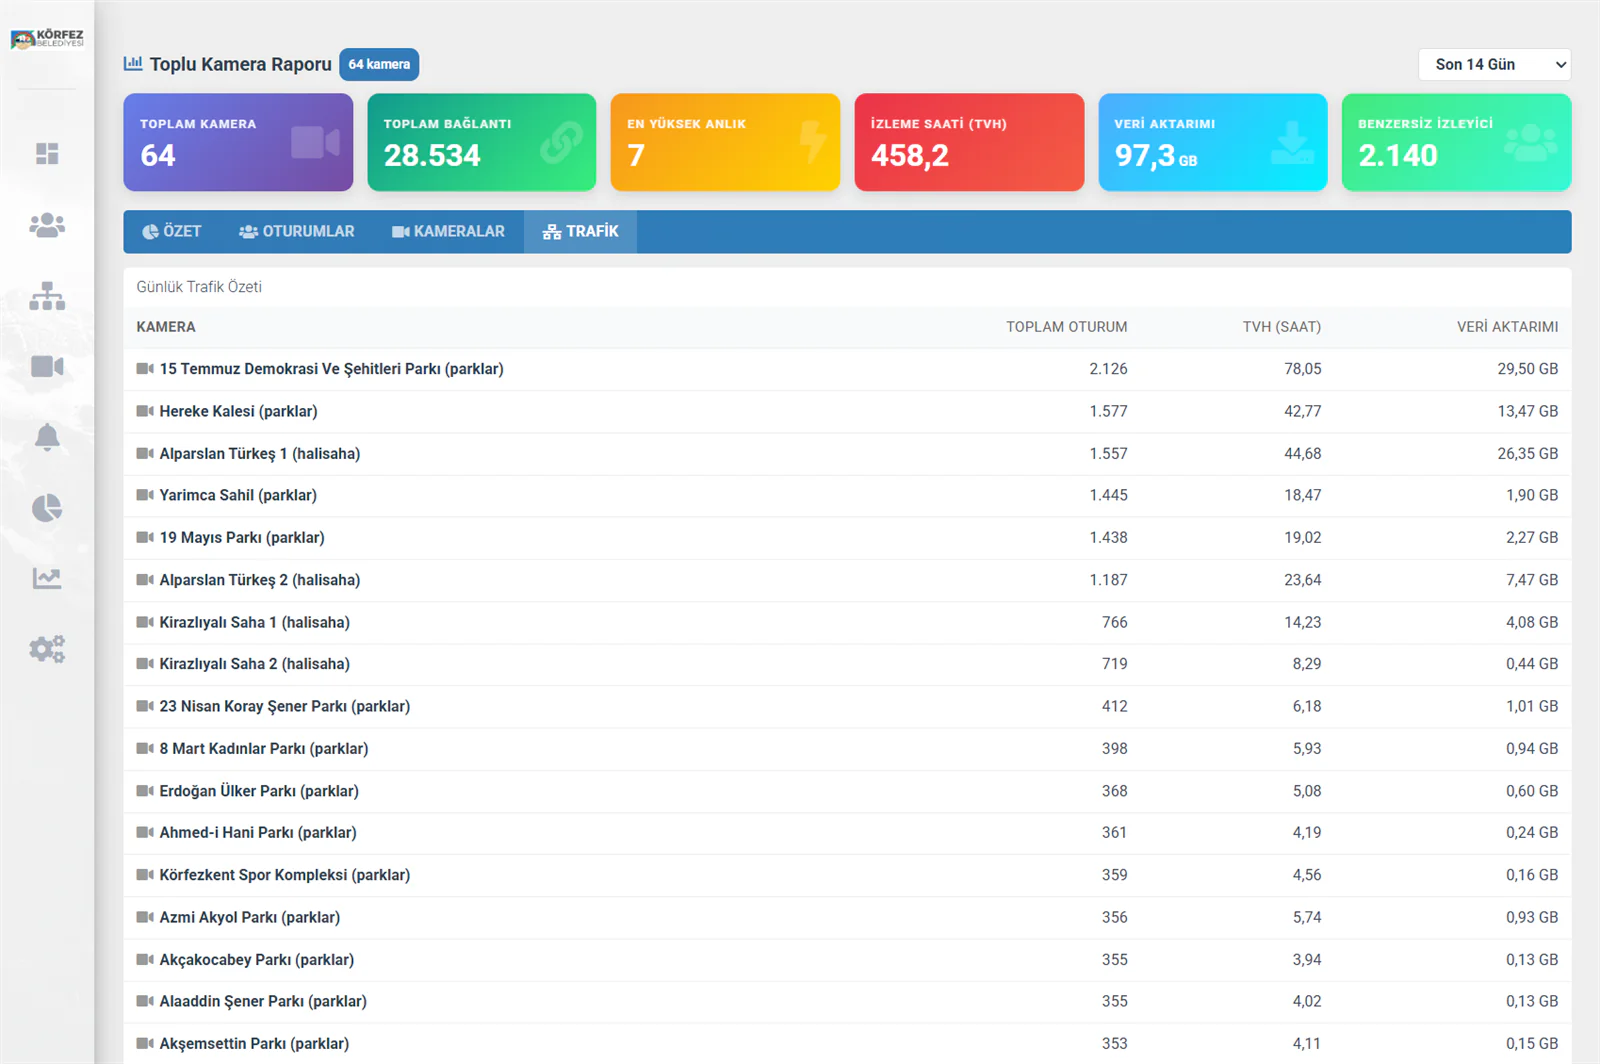
Daily Traffic Summary table:
| Column | Description |
|---|---|
| Camera | The camera name and the user group it belongs to (in brackets) |
| Total Sessions | The total number of connections to that camera in the selected period |
| TVH (Hours) | Total Viewing Hours — the camera's combined watch time |
| Data Transfer | The total bandwidth consumed by that camera (GB) |
The table is sorted by total session count in descending order, so the most-watched camera appears at the top.
The data transfer column shows you which cameras consume the most bandwidth. Optimising the bitrate on heavy consumers lets you bring server costs down. Recommended bitrates: 1200 Kbps for fixed cameras, 2000 Kbps for moving cameras.
Glossary of Summary Metrics
| Abbreviation | Full Name | Description |
|---|---|---|
| TVH | Total Viewing Hours | The combined watch time of all viewers, in hours |
| TVM | Total Viewing Minutes | The combined watch time of all viewers, in minutes |
| Session | Session / Connection | The time between a viewer joining the stream and leaving it |
| Unique Viewers | Unique IP | The number of distinct viewers counted by IP address |
| Peak Concurrent | Peak Connections | The highest number of viewers at the same time |
| Data Transfer | Bandwidth / Transfer | The total volume of data delivered to viewers (GB) |
At a Glance
Bulk Comparison
Compare all your cameras side by side using the bar chart and ranking table on the Cameras tab.
Geographic Analysis
See which countries your viewers connect from, and the country breakdown, on the Sessions tab.
Device Analysis
Find out which browsers and devices your viewers use from the user agents table.
Period Comparison
Change the period selector to compare your performance across different time ranges.