
Detailed Audience Analysis
Who is watching your camera, where are they watching from, and for how long? Track your streams professionally with real-time and historical statistics, a geographic distribution map, hour-by-hour analysis and downloadable reports.
Reaching the Reporting Page
On your camera management page, click the Reporting tab in the top menu. Use the date picker at the top right to choose the period you want (for example the last 7 days, the last 30 days, or a custom range).
Reporting consists of 4 tabs:
Summary
General statistics, viewer trends and downloadable reports.
Sessions
Detailed session data, a world map, country and city breakdowns, and your top viewers.
By Time Range
Session analysis by hour and by day to identify peak periods.
Traffic
A table of daily bandwidth consumption (GB).
1. Summary Tab
Shows the general statistics, viewer trend and downloadable reports for the selected date range.
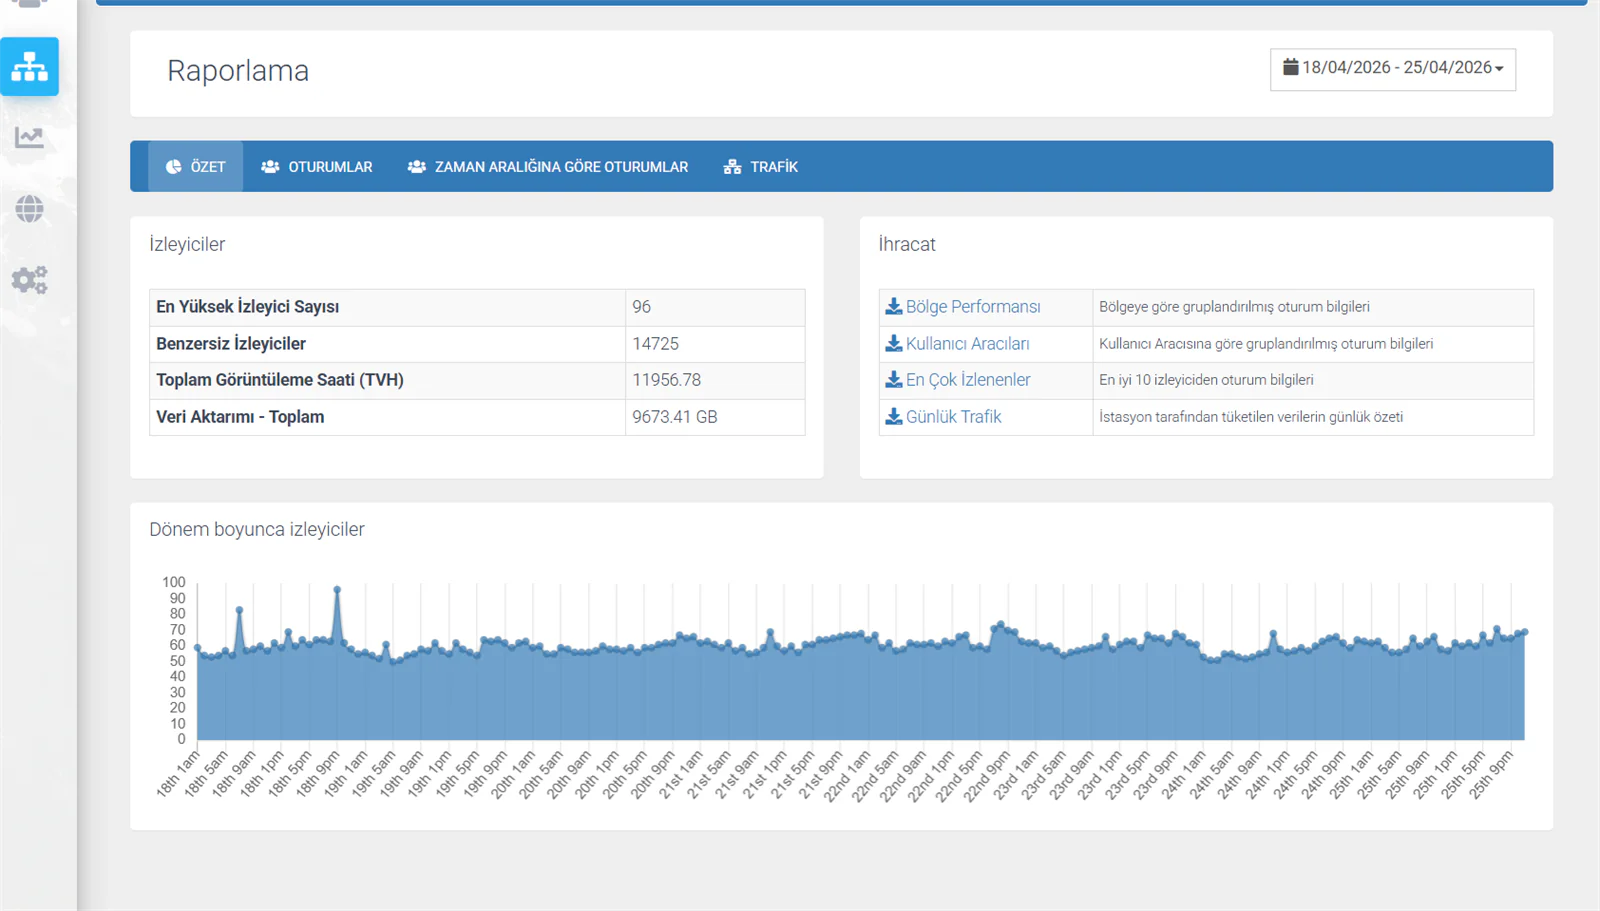
Viewer Statistics
| Metric | Description |
|---|---|
| Peak Concurrent Viewers | The highest number of people watching at the same time during the selected period |
| Unique Viewers | The number of distinct viewers — the same person counts as 1 even if they watch several times |
| Total Viewing Hours (TVH) | The combined watch time of all viewers, in hours |
| Data Transfer - Total | Total bandwidth consumption (GB) |
Viewers Over the Period Chart
An area chart showing how your viewer count changed hour by hour across the selected date range. You can see peak hours and any rises and falls in your audience at a glance. It lets you spot trends such as the evening surge typical of news sites, or the weekend peaks seen on seafront cameras.
Downloadable Reports (Export)
You can download detailed reports as files from the Export section at the top right:
| Report | Contents |
|---|---|
| Regional Performance | Session information grouped by country and city |
| User Agents | Data grouped by browser and device type |
| Top Viewers | Details of the 10 viewers with the highest viewing figures |
| Daily Traffic | A summary of daily bandwidth consumption |
Open the downloaded reports in Excel or Google Sheets to run your own analysis, add them to presentations or pass them on to your management. Every report is filtered according to the selected date range.
2. Sessions Tab
Shows a detailed breakdown of viewer sessions, their geographic distribution and a world map. This tab has two sections.
Summary and Session Data
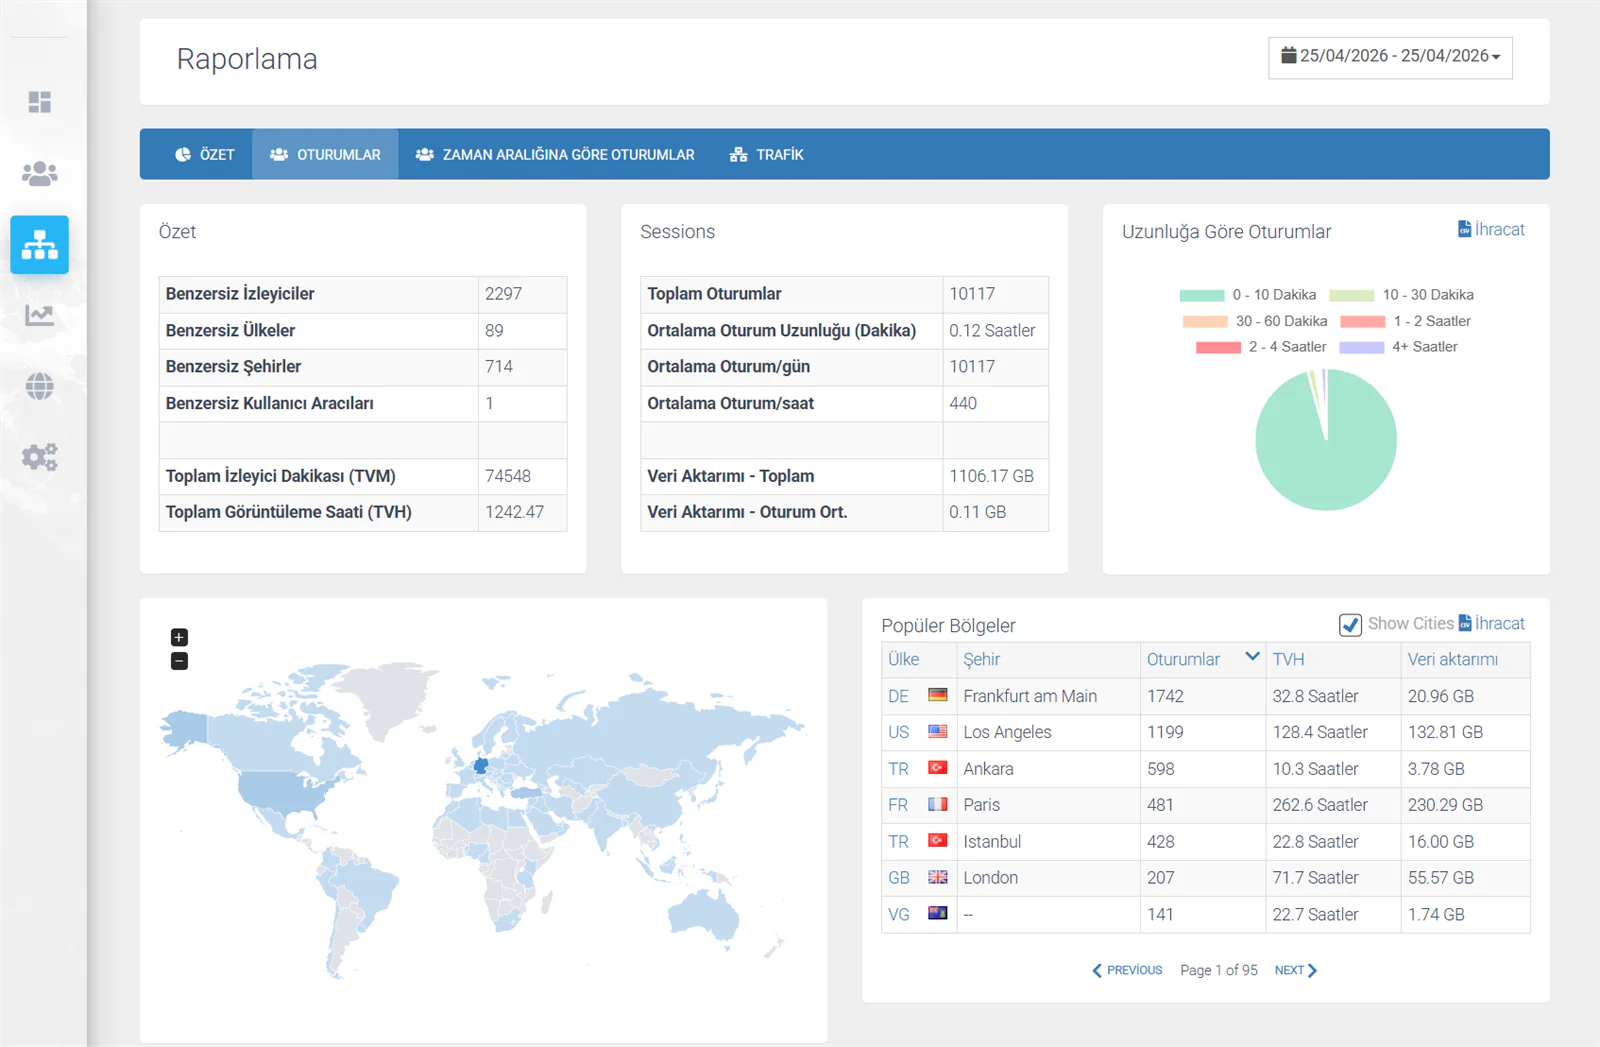
The Summary panel shows unique viewer, country and city counts along with total watch time. The Sessions panel presents the total number of sessions, average session length, daily and hourly averages, and data transfer details.
| Metric | Description |
|---|---|
| Unique Viewers | The number of distinct viewers |
| Unique Countries | How many different countries watched |
| Unique Cities | How many different cities watched |
| Total Viewing Minutes (TVM) | The combined watch time of all viewers, in minutes |
| Total Sessions | The total number of connections |
| Average Session Length | How long a viewer watches on average |
| Average Sessions/Day | The average number of sessions per day |
| Average Sessions/Hour | The average number of sessions per hour |
| Data Transfer - Session Avg. | Average data consumption per session |
The Sessions by Length pie chart shows how long viewers watched for: 0-10 minutes, 10-30 minutes, 30-60 minutes, 1-2 hours, 2-4 hours and 4+ hours.
Geographic Distribution and Detailed Tables
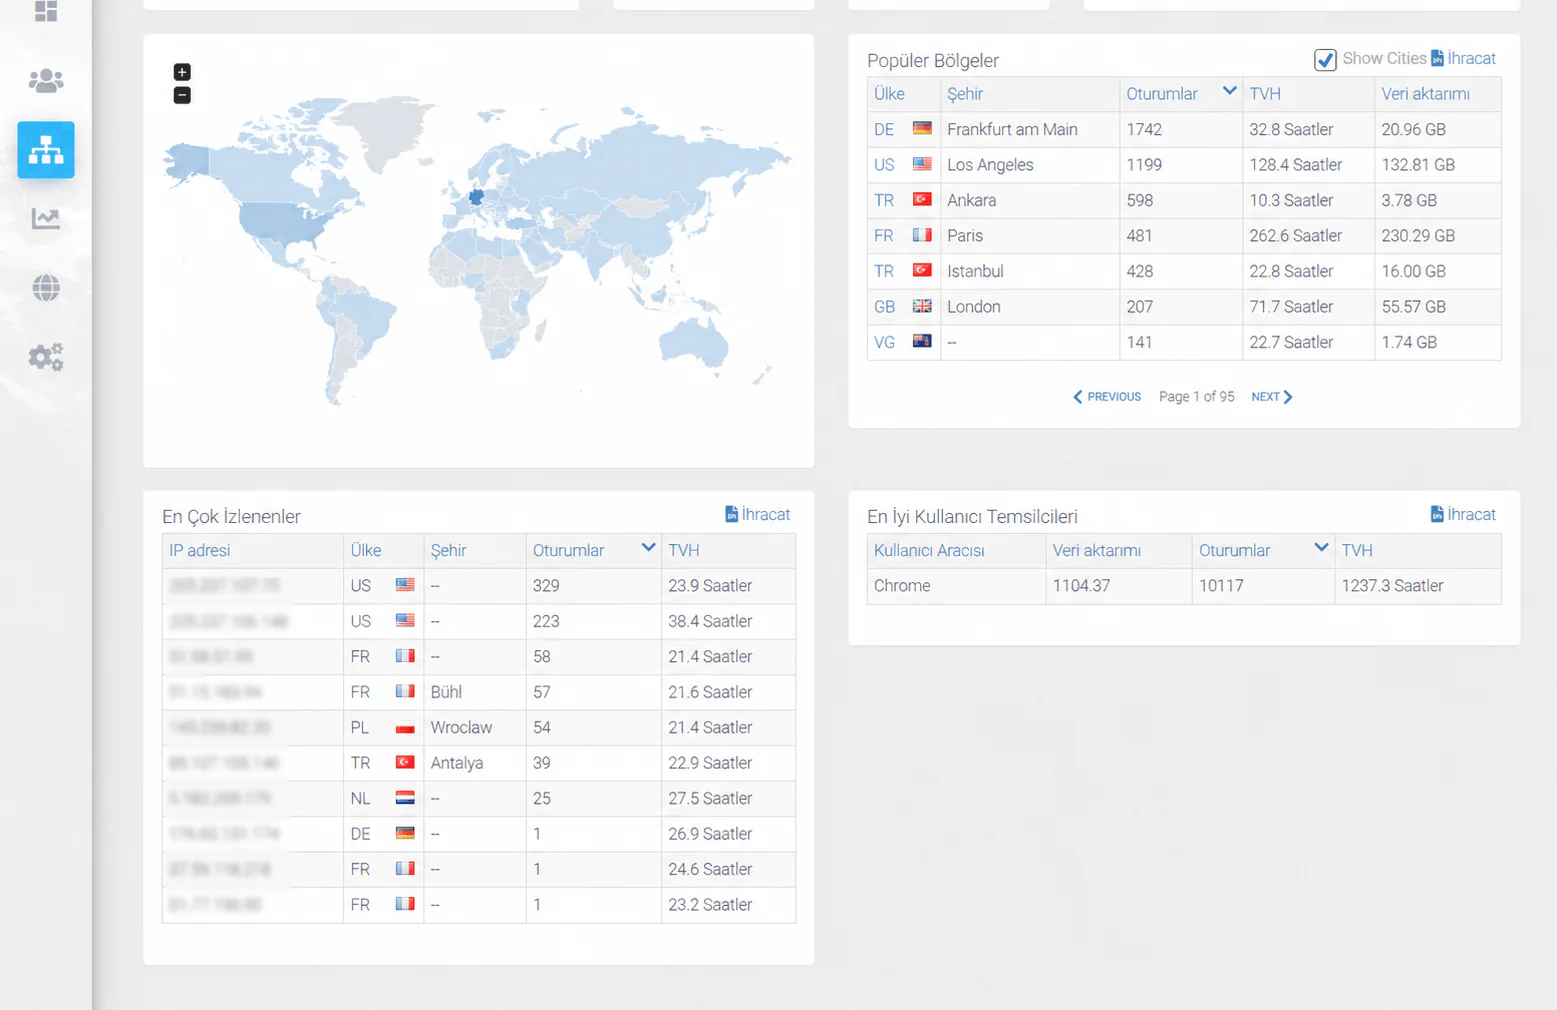
Follow the geographic spread of your viewers visually on the World Map. Darker regions indicate heavier viewer traffic.
The Popular Regions table lists country, city, session count, total viewing hours (TVH) and data transfer. Enable the Show Cities option to see a city-level breakdown.
The Top Viewers table lists your most active viewers with their IP address, country, city, session count and viewing hours.
The Top User Agents table shows how much viewing came from each browser or device (Chrome, Safari, mobile apps and so on).
Knowing which countries and cities your camera is watched from helps you understand your audience. Municipalities can measure citizen reach, tourism cameras can gauge international interest, and businesses can build a picture of their customer profile.
3. Sessions by Time Range
At which hours and on which days is your camera watched most? Use this tab to identify your busiest patterns.
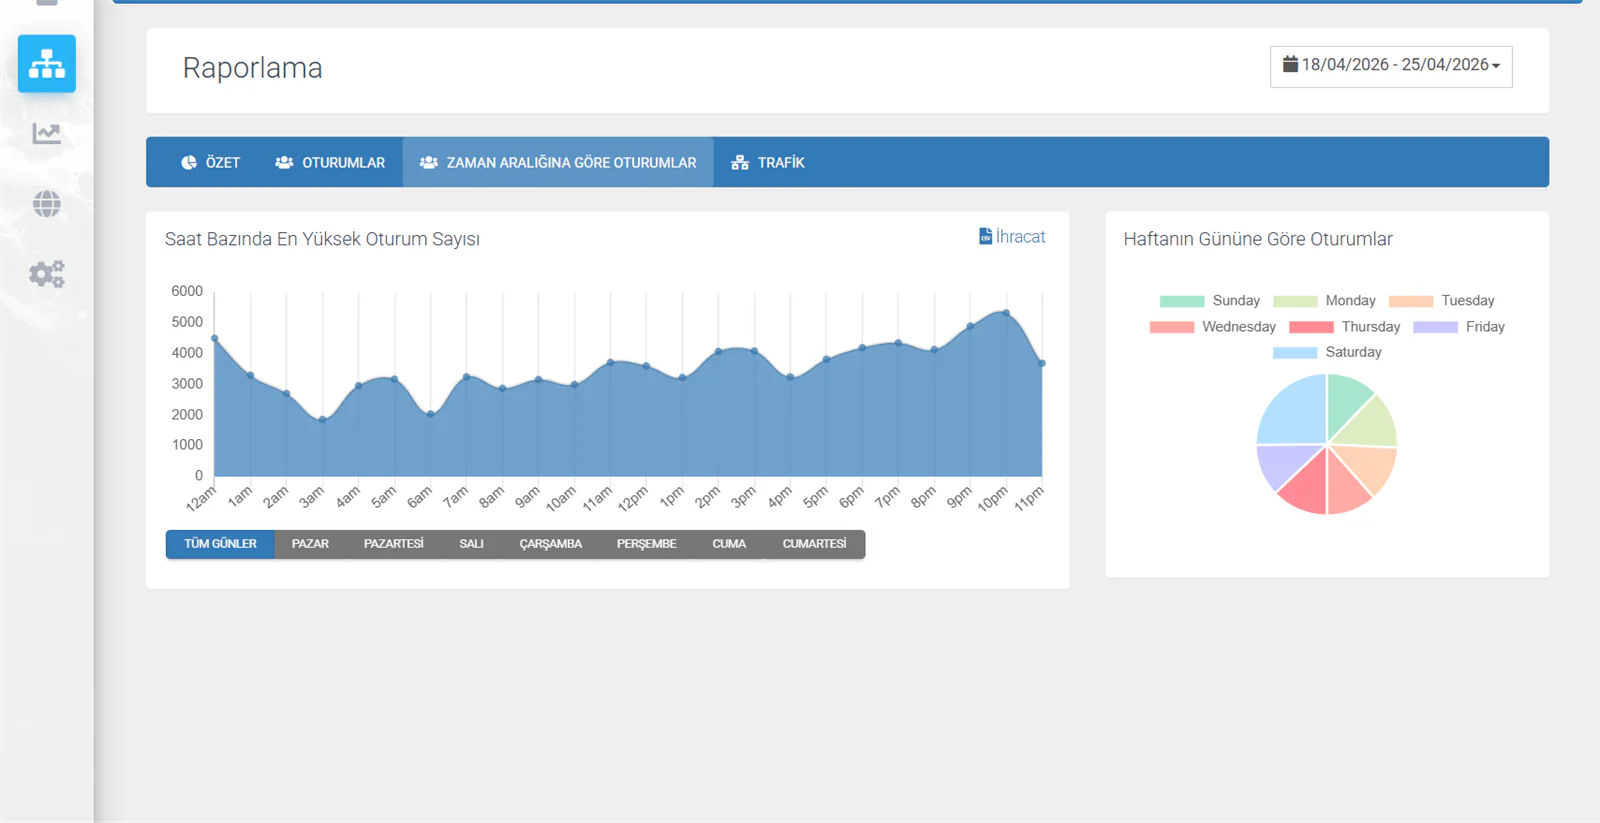
Peak Sessions by Hour
A 24-hour area chart showing the peak session count for each hour. Use the day filters underneath to focus on a specific day:
All Days — Sunday — Monday — Tuesday — Wednesday — Thursday — Friday — Saturday
When you click a day, the chart shows data for that day only. This makes it easy to answer questions such as "does our audience grow on Friday evenings?"
Sessions by Day of the Week
A pie chart showing which days of the week attract the most viewing, so you can compare weekday and weekend audiences.
Seafront and tourism cameras typically peak at weekends, traffic cameras during commuting hours, and municipal cameras in the evening. You can use this data to optimise stream quality around your busiest hours and to plan when you share on social media.
4. Traffic Tab
Shows daily bandwidth (data transfer) consumption as a table.
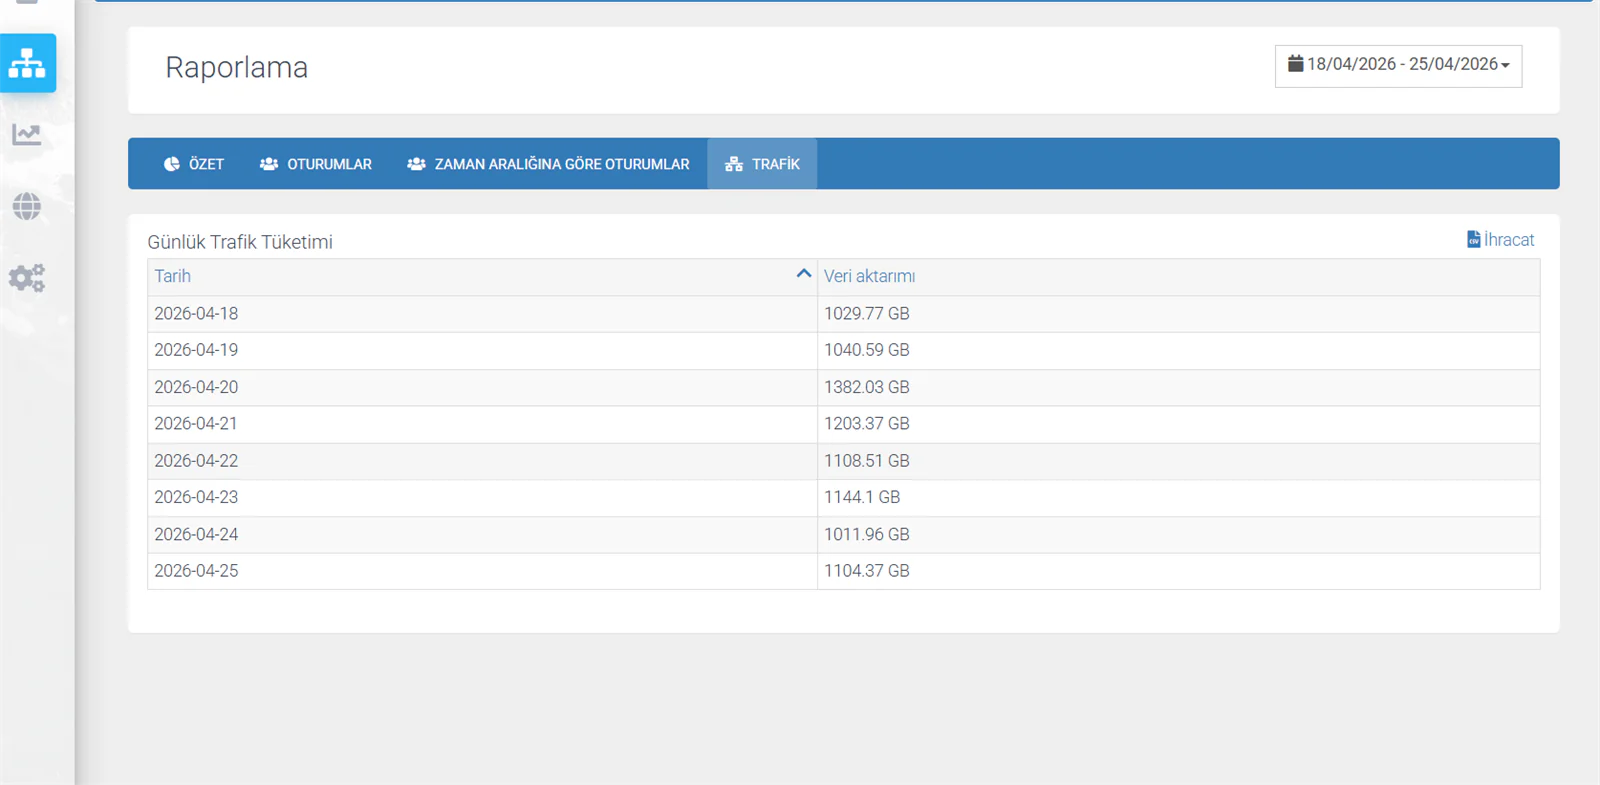
| Column | Description |
|---|---|
| Date | The date, day by day |
| Data Transfer | Total bandwidth consumed that day (GB) |
Use the Export button at the top right to download your traffic data as a file.
Tracking bandwidth consumption lets you plan server capacity, spot abnormal spikes (DDoS or bot traffic) and keep costs under control. If you see a sudden jump in daily consumption, get in touch with our support team.
Bulk Reporting
This page covers reporting for a single camera. To see combined statistics for all your cameras, comparative charts and monthly AI-assisted analysis reports, take a look at the Bulk Reporting page under Panel Settings. Monthly reports are also sent automatically by e-mail.